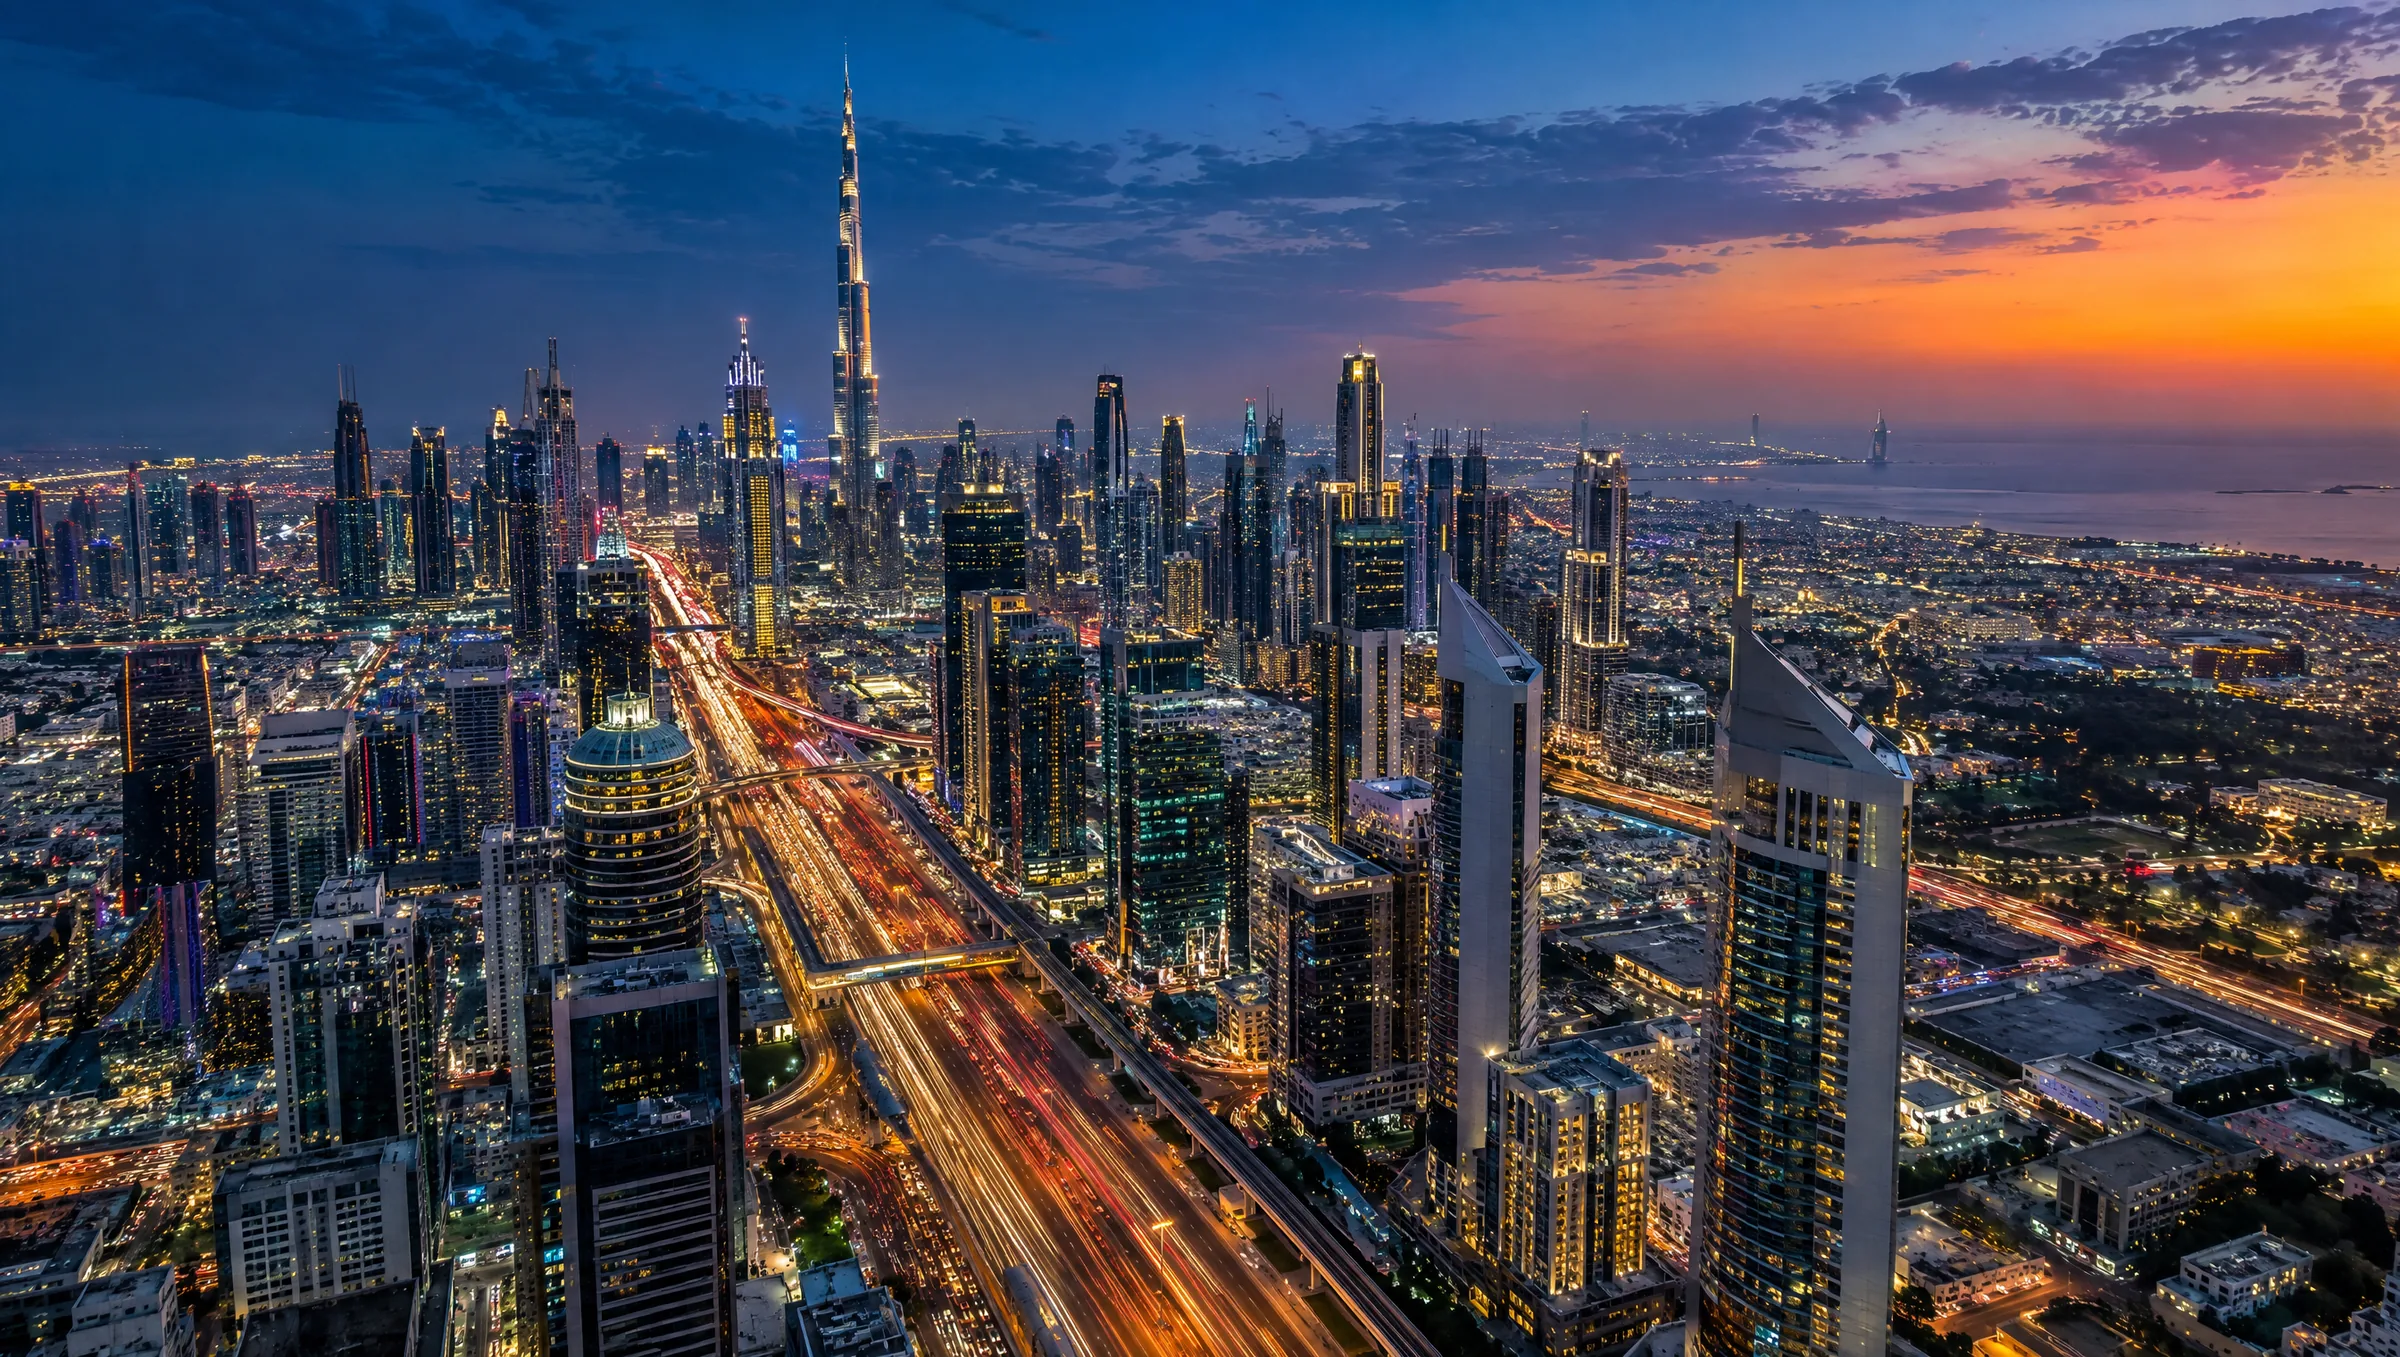
Dubai skyline and Sheikh Zayed Road at blue hour (illustration)
UAE MARKET · UPDATED 11 NOVEMBER 2026

Dubai & Ajman, in numbers.

The monthly figures from the Dubai Land Department and Ajman's land department, plus prices, rents and yields by area — with the source next to every number. We update this page every month.

OCTOBER 2026 · DUBAI SALES
AED 34.12B
11,610 sales registered
AED 34.12B
SALES VALUE · OCTOBER 2026
11,610
SALES TRANSACTIONS
58%
OFF-PLAN BY COUNT · 6,698 DEALS
42%
READY BY COUNT · 4,907 DEALS
AED 12.68B
MORTGAGES · 4,552 REGISTERED
THIS MONTH 12 MONTHS PRICES AREAS RENTS & YIELDS AJMAN RIGHT NOW MONTHLY REPORT BUYING GUIDE →
01
THIS MONTH · DUBAI

Off-plan wins on count. Ready wins on value.

OFF-PLAN · OCTOBER 2026
DEALS
6,698
58% of all sales
VALUE
AED 13.13B
38% of sales value
AVERAGE DEAL
AED 1.96M
value ÷ deals
READY · OCTOBER 2026
DEALS
4,907
42% of all sales
VALUE
AED 20.99B
62% of sales value
AVERAGE DEAL
AED 4.28M
value ÷ deals
YEAR TO DATE
AED 412.0B
Sales, January – October · 134,730 deals
AED 215.6B
Ready homes · 43,970 deals
AED 196.4B
Off-plan · 90,760 deals
AED 624.8B
All registrations incl. mortgages and gifts · 67.99% of 2025's full year
SOURCE: DUBAI LAND DEPARTMENT FIGURES, OCTOBER 2026 AND JANUARY–OCTOBER, REPORTED BY EMIRATES 24|7 AND EMARAT AL YOUM, 31 OCT 2026
02
TWELVE MONTHS · DUBAI SALES VALUE, AED BILLION

A record start, then a steadier market.

20B 40B 60B 64.22 NOV 2025 19,024 64.82 DEC 2025 19,220 72.16 JAN 2026 15,896 60.6 FEB 2026 16,959 43.1 MAR 2026 13,544* 48.5 APR 2026 13,796* 29.46 MAY 2026 10,483 32.66 JUN 2026 13,766 35.5 JUL 2026 14,420* 27.89 AUG 2026 11,600 29.66 SEP 2026 11,430 34.12 OCT 2026 11,610
Bars: sales value per month, AED billion. Figures under the months: number of sales. Hatched bars and * = derived from the Land Department's cumulative totals (no direct monthly release found). Mortgages and gifts are excluded.
AED 72.16B
The peak month — Jan 2026, the highest January on record.
AED 27.89–35.5B
The monthly range since May — roughly half the winter pace, and steady.
+15%
October against September — a second monthly rise in a row.
SOURCE: DUBAI LAND DEPARTMENT FIGURES, OCTOBER 2026 AND JANUARY–OCTOBER, REPORTED BY EMIRATES 24|7 AND EMARAT AL YOUM, 31 OCT 2026 · JAN–AUG 2026 · H1 2026 · Q1 2026 · FEB 2026 · JAN 2026 · MAY 2026 · OCT–DEC 2025 · COUNTS FOR OCT & NOV 2025: FÄM PROPERTIES, MIRA INTERNATIONAL
03
PRICES · OCTOBER 2026 INDEX · PER SQ FT AS OF AUGUST 2026

Prices have eased from the February peak.

AVERAGE PRICE PER SQ FT
AED 1,513
all residential, weighted · August 2026
VILLAS PER SQ FT
AED 2,035
August 2026 · villa index -4.8% year on year (October)
APARTMENTS PER SQ FT
AED 1,394
August 2026 · apartment index -7.2% year on year (October)
PRICE INDEX, YEAR ON YEAR · OCTOBER
-5.7%
+0.1% on the month · -10.2% from the February peak
SOURCE: VALUSTRAT PRICE INDEX, DUBAI RESIDENTIAL VALUES, OCTOBER 2026 (VPI 218.9, +0.1% M/M, −5.7% Y/Y; KHALEEJ TIMES, 11 NOV 2026) · PER SQ FT: VALUSTRAT PRICE INDEX, AUGUST 2026, REPORTED BY KHALEEJ TIMES, 9 SEP 2026
APARTMENTS · H1 2026 · ASKING PRICES ON BAYUT, AED / SQ FT
AREAAED / SQ FT
Downtown DubaiAED 3,179
Dubai Hills EstateAED 2,522
Business BayAED 2,124
Dubai MarinaAED 2,111
JVCAED 1,470
Dubai Silicon OasisAED 1,086
VILLAS · H1 2026 · ASKING PRICES ON BAYUT, AED / SQ FT
AREAAED / SQ FT
Dubai Hills EstateAED 2,870
Arabian RanchesAED 2,184
DAMAC HillsAED 1,876
DubailandAED 1,609
DAMAC Hills 2AED 1,072
SOURCE: BAYUT DUBAI SALES MARKET REPORT, H1 2026
04
WHERE THE DEALS ARE

Business Bay leads on value. Dubai South on volume.

JANUARY – SEPTEMBER 2026 · SALES VALUE BY DLD DISTRICT
1  Business BayAED 20B+
2  Airport City (Dubai South)AED 17.72B
3  Al Yalayis 1AED 16.09B
4  Palm Deira (Dubai Islands)AED 12.98B
5  Palm JumeirahAED 11.61B
AUGUST 2026 · SHARE OF READY-HOME SALES
JVC12.1%
Business Bay6.1%
Dubai Marina5.9%
Downtown Dubai3.8%
Dubai Hills Estate3.8%
AUGUST 2026 · SHARE OF OFF-PLAN SALES
Azizi Venice (Dubai South)19.8%
City of Arabia10%
Jebel Ali Downtown7.7%
JVC4.7%
Dubailand Residence Complex4.1%
District names in the first column are the Land Department's registration districts; the community names in brackets are how the market usually refers to them.
SOURCE: DUBAI LAND DEPARTMENT FIGURES, REPORTED BY EMIRATES 24|7, 1 OCT 2026 · SHARES: VALUSTRAT PRICE INDEX, AUGUST 2026, REPORTED BY KHALEEJ TIMES, 9 SEP 2026
05
RENTS & YIELDS

What homes rent for, and what they return.

APARTMENTS · H1 2026 · AVERAGE ASKING RENTS ON BAYUT, AED / YEAR
AREA1-BED2-BEDGROSS YIELD
Downtown DubaiAED 133,000AED 223,0005.46%
Dubai MarinaAED 103,000AED 157,0005.88%
Business BayAED 104,000AED 148,0006.29%
Sobha Hartland (MBR City)AED 99,000AED 154,0006.41%
JVCAED 79,000AED 113,0007.15%
VILLAS & TOWNHOUSES · H1 2026 · AVERAGE ASKING RENTS ON BAYUT, AED / YEAR
AREA3-BED4-BEDGROSS YIELD
Arabian Ranches—AED 404,0003.87%
Dubai Hills Estate—AED 359,0004.30%
DAMAC HillsAED 211,000AED 230,0004.95%
Dubai SouthAED 147,000AED 191,000—
DAMAC Hills 2AED 112,000AED 124,0006.03%
THE TREND
-6.81%
Rents year on year · September 2026 · Reidin Rent Index
-1.47%
Rents month on month
~7% · ~5%
Typical gross yield, apartments · villas (H1 2026)
Rents and yields are Bayut's averages of asking prices, not registered contracts. Rent indices differ by method: REIDIN's September index is shown here.
SOURCE: BAYUT DUBAI RENTAL MARKET REPORT, H1 2026 · YIELDS: BAYUT DUBAI SALES MARKET REPORT, H1 2026 · TREND: REIDIN UAE RESIDENTIAL PRICE REPORT, SEPTEMBER 2026, 12 OCT 2026 · SEGMENT YIELDS: CAVENDISH MAXWELL, H1 2026 RESIDENTIAL REPORT, ZAWYA, 30 JUL 2026
06
AJMAN

Smaller market, same direction.

ALL TRANSACTIONS · OCTOBER 2026
AED 1.95B
1,140 transactions
SALES · OCTOBER 2026
AED 1.22B
900 sales
H1 2026 · ALL TRANSACTIONS
AED 10.8B
6,815 transactions · H1 2025: AED 12.4B
Q1 2026 VS Q1 2025
+12%
the latest official growth figure
RENTAL CONTRACTS · H1 2026
AED 2.91B
73,472 contracts
MOST-TRADED NEIGHBOURHOODS · OCTOBER 2026
Al Helio 2 · Manama 14 · Al Helio 1
Most-traded projects: Emirates City, City Towers, Ajman One. Al Helio 2 has topped the ranking in every monthly release this year — it is where Globex builds next. Al Zahya, home of The Stars Villas, was in the top three in September.
AL ZAHYA · ASKING PRICES ON BAYUT, 2 OCT 2026
AED 1.35M
3-bed villa, average asking
AED 1.64M
4-bed villa, average asking
AED 89,478 · 98,068
3-bed · 4-bed villa rent, per year
The Stars Villas, Al Zahya — from AED 1.5M →
SOURCE: AJMAN DEPARTMENT OF LAND AND REAL ESTATE REGULATION, OCTOBER 2026, ARABIAN BUSINESS, 11 NOV 2026 · H1 2026 · Q1 2026 · RENTAL CONTRACTS · AL ZAHYA ASKING PRICES
07
RIGHT NOW · WHAT THE NUMBERS SAY

A buyer's moment for ready homes.

Prices are 10.2% below the February peak and ready apartments are 7.2% cheaper than a year ago, while off-plan still takes about two of every three deals this year. In plain terms: ready buyers have more negotiating room than they have had since 2021; off-plan buyers are paying for choice and payment terms, not for a discount. Rents are easing too, so the buy-or-rent sum is worth doing with real numbers.

BUYING GUIDE · 01
What AED 1.5M, 3M or 5M buys
Real homes from our listings, by budget.
BUYING GUIDE · 02
Buy or keep renting?
Put your own numbers in — two minutes.
BUYING GUIDE · 03
Ready or off-plan, and what it really costs
Side by side, with every fee listed.
08
THE MONTHLY REPORT

November 2026 report — October in five lines.

Dubai registered 11,610 sales worth AED 34.12 billion in October, up from AED 29.66 billion in September. Off-plan took 58% of the deals but only 38% of the value: buyers of ready homes paid about AED 4.3 million per deal on average, off-plan buyers about AED 2.0 million. Year to date the city has sold AED 411.98 billion of property, and ready homes (AED 216 billion) are now slightly ahead of off-plan (AED 196 billion) by value. Prices have eased over the year: the October price index was 5.7% below a year earlier and 10.2% below the February peak, with apartments softer than villas — but it rose 0.1% on the month, the first monthly rise since February. In Ajman, October brought 1,140 transactions worth AED 1.95 billion, and Al Helio 2 was again the most-traded neighbourhood.

SEND ME THE MONTHLY REPORT SEE OUR LISTINGS
ARCHIVE · NOVEMBER 2026 (OCTOBER DATA) · NEXT UPDATE: EARLY DECEMBER 2026
SOURCES
Official figures come from the Dubai Land Department and the Ajman Department of Land and Real Estate Regulation as published in the press on the dates shown. Price, rent and yield figures are from the named research houses and portals. Where two outlets disagree we use the Land Department figure. This page is information, not investment advice.
SALES & RENTALS ACROSS DUBAI AND AJMAN

Numbers are the start. Talk to us about yours.

ENQUIRE ON WHATSAPP ALL INVENTORY